On June 14, IDATE held its annual debate on the future of digital trends: Digiworld Future. This was an opportunity to reveal the visualization tool that b<>com has developed to browse its partner's data.
In Paris: 550 participants, mainly decision-makers from member companies of IDATE, and recognized speakers like Michel Combes (SFR), Gilles Pélisson (TF1), Isabelle Kocher (ENGIE), Jacques Attali, Axelle Lemaire, etc.
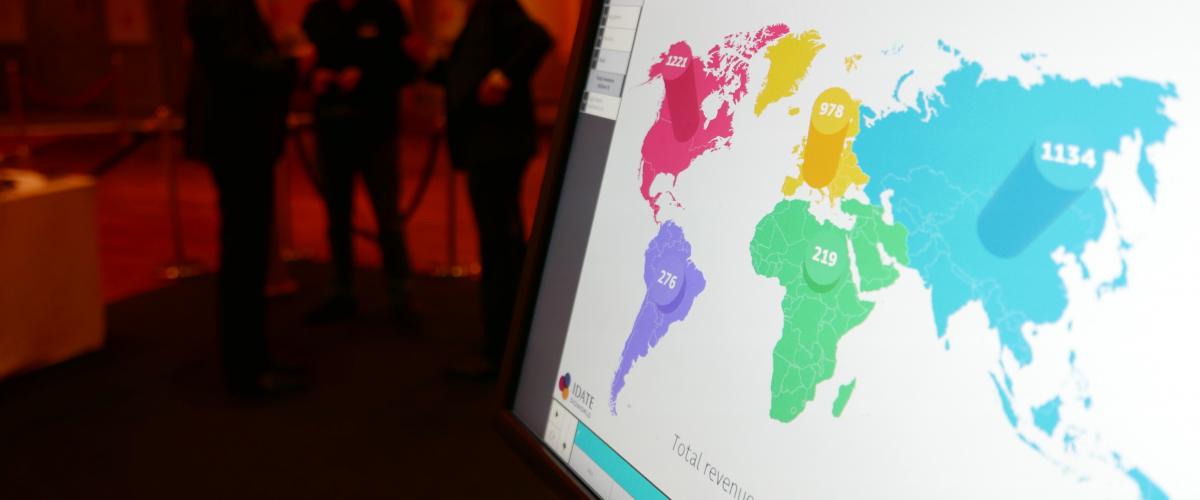
Yves Gassot, CEO, and François Barrault, President of the institute and the morning event's host, explained trends in the Internet, television, and telecoms. Three of these trends were illustrated by b<>com *Data SpotR* and presented in the form of a video that makes it possible to view growth in American and European markets and see Asian countries catch up. Also clearly appearing were the proliferation of Internet service, which by itself illustrate the growth in the sectors analyzed by IDATE. Finally, the differences in the evolution of TV over IP by world region proved impressive.
The features of b<>com *Data SpotR* were presented at the same time at a demonstration stand staffed by teams from b<>com and IDATE who worked together to develop the tool. This way, event participants were able to enjoy:
- Seeing the potential of the data reveal itself, by highlighted trends buried in complex data
- Different 2D or 3D visualization methods: point cloud, histogram, map
- Easy to use and ergonomical interface
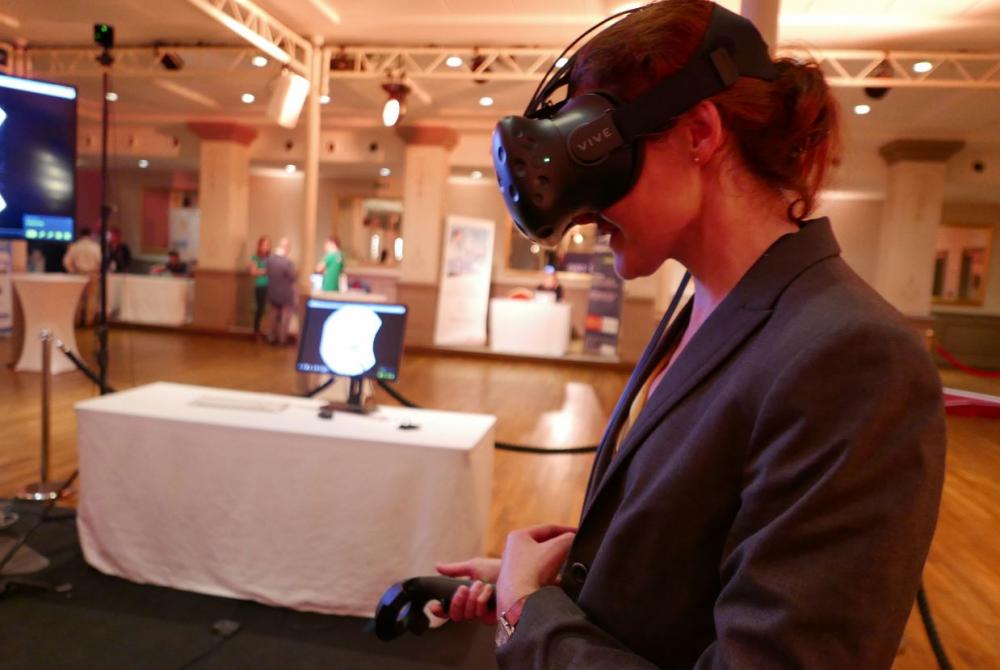
VR for another data visualization experience
b<>com has taken interaction with data one step further, be offering an exclusive virtual reality experience. Equipped with HTC Vive headset, guests at Digiworld Future were able to "dive" into the data, fly over the map, pass through the point cloud, go around the histogram, mark and display additional information, etc. It's a fairly natural experience that presages the future of data visualization.
The technology is fresh out of the lab, and its potential uses are numerous: Confirming the quality and relevance of databases, depicting data in an appealing and dynamic fashion for communication purposes, etc.